

Author:
(1) Abdulnasser Hatemi-J, Department of Economics and Finance, UAE University ([email protected]).
Content Overview
Abstract
-
Introduction
-
Symmetric and Asymmetric CAPMs
2.1 The Symmetric CAPM
2.2 The Asymmetric CAPM
-
Application
-
Concluding Remarks, Acknowledgements, and References
Abstract
Providing a measure of market risk is an important issue for investors and financial institutions. However, the existing models for this purpose are per definition, symmetric. The current paper introduces an asymmetric capital asset pricing model for the measurement of market risk. It explicitly accounts for the fact that falling prices determine the risk for a long position in the risky asset and rising prices govern the risk for a short position. Thus, a position-dependent market risk measure that is provided accords better with reality. The empirical application reveals that Apple stock is more volatile than the market only for the short seller. Surprisingly, the investor that has a long position in this stock is facing a lower volatility than the market. This property is not captured by the standard asset pricing model, which has important implications for the expected returns and hedging designs.
1. Introduction
Determining the fair rate of return for a risky asset such as a stock is of fundamental importance in computational finance. This risk consists of two components—namely (1) systematic or market risk and (2) unsystematic or firm specific risk. The firm specific risk can be neutralized via efficient portfolio diversification via methods suggested by Markowitz (1952) or Hatemi-J and El-Khatib (2015) and Hatemi-J, Hajji and El-Khatib (2022). The market risk is not diversifiable, however. An alternative approach is needed for hedging the market risk. The capital asset pricing model (CAPM) developed by Sharpe (1964) is considered as the first attempt to provide a measure for market risk, which can also function as the optimal hedge ratio for neutralizing this risk via futures. Even though the CAPM is attributed to Sharpe (1964), according to literature Treynor (1961), Littner (1965a, b) and Mossin (1966) also deserve to be credited for development of this model independently. For a review of the CAPM see Fama and French (2004). For new extensions of this model see Habis (2024). Also, for the advantages of estimating the asset pricing model via neural networks method see Chen et. al., (2024).[1] The fundamental implicit assumption by Sharpe (1964) is that the investor is has a long position in the risky asset. However, it is also possible that the investor undertakes a short position in the underlying risky asset. This paper suggests an asymmetric version of the CAPM that explicitly takes the position of the trader into account. This is an important issue because the source of risk for the long position is falling prices while the source of risk for a short seller is the rising prices. The standard CAPM does not make a separation of the direction of the price changes and any price change is part of the risk regardless of if it is positive or negative.
The rest of this paper is structured as follows. In the next section symmetric and asymmetric CAPMs are presented. In section 3 a numerical application is provided. Conclusions are presented at the end.
2. Symmetric and Asymmetric CAPMs
In the first part of this section, we describe the standard CAPM, which we call the symmetric CAPM. In the second subsection we introduce the asymmetric version of this model.
2.1 The Symmetric CAPM
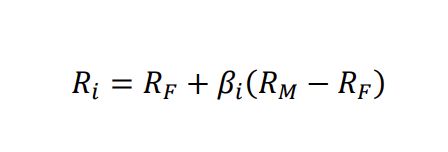
According to the symmetric model the unsystematic (i.e., firm specific) risk can be neutralized via portfolio diversification. Thus, in a market that is at equilibrium the investors will be only compensated for the systematic (i.e., the market) risk.[2] The standard CAPM is based on the following equation:
3. Application
A numerical example is provided for measuring the market risk for Apple stock during the period of September 2020 until March 2024 on a monthly basis. The choice of the sample period is based on covering the period after a four-to-one stock split that took place on 31 of August 2020. The NASDAQ Composite is used as a measure of the market index during the period. The source of the data is Yahoo Finance. The empirical findings are presented in Table 1.
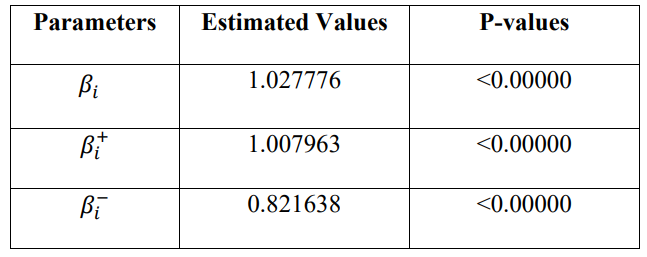
As it is evident from the empirical results, the standard beta measure (i.e., the symmetric one) is equal to 1.027776. Thus, a trader that has a long position in the stock needs to have 1.027776 units of short futures for each unit of spot to hedge. On the other hand, the trader with a short position in the stock needs to have 1.027776 units of long futures for each unit of spot to hedge. However, the results change to some extent if asymmetric beta measures are used. In this case, an investor with a short position in the stock needs to have 1.007963 unit of long futures for optimal hedging. While an investor with a long position in the stock should have 0.821638 units of short futures for optimal hedging. Interestingly, this asymmetric approach reveals that Apple stock is riskier than the market if and only if the investor has a short position in the stock. An investor with a long position in the Apple stock faces a lower risk than the market since its beta is lower than one. If the position dependent measures of market risk were not used one would conclude that the investor of Apple stock is facing higher risk than the market regardless of if the investor is the owner of the stock or is short selling. It should be mentioned that the estimated parameter is statistically significant in each case.
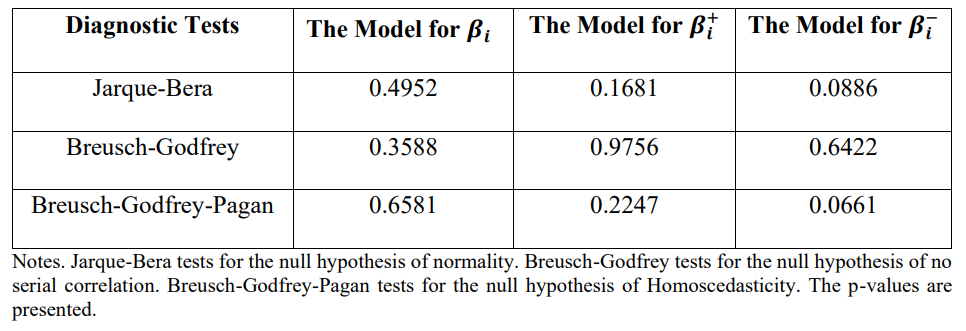
To test desirable statistical assumptions for a good model based on the least squares method that is used to estimate the beta values, a number of diagnostic tests are conducted. The empirical findings of these tests are presented in Table 2. The results reveal that the null hypothesis that each assumption is fulfilled cannot be rejected at the five percent significance level for each model.
4. Concluding Remarks
It is a fact that the source of risk for a long position in a risky asset is determined by the falling prices while the source of the risk for a short position in the underlying asset is the rising prices. The current paper argues that explicitly considering this asymmetric property is important for successful risk management and hedging purposes. A position dependent measure of market risk is presented in this paper. A numerical example is also provided, which reveals that an investor of the Apple stock faces a higher level of risk compared to the market for a short position in that stock only. However, for a long position in the Apple stock, the risk of this stock is lower than the market risk. These empirical findings based on the suggested approach have important implications in terms of the expected returns and for designing optimal hedging strategies in each case. Future applications of this method will demonstrate, however, whether this asymmetric property of the market risk is a general phenomenon for different classes of risk assets or not.
Acknowledgements
The current paper is partially funded by the CBE Annual Research Program (CARP) 2024 granted by the United Arab Emirates University, which is immensely appreciated. The usual disclaimer applies, however.
References
Andrei, D., Cujean, J., and Wilson, M. (2023) The lost capital asset pricing model. Review of Economic Studies, 90(6), 2703-2762.
Bagnara M. (2024) Asset pricing and machine learning: A critical review. Journal of Economic Surveys, 38(1), 27-56.
Chen L., Pelger M. and Zhu J. (2024) Deep learning in asset pricing. Management Science, 70(2), 714-750.
Fama E.F. and French K.R. (2004) The capital asset pricing model: Theory and evidence. Journal of Economic Perspectives, 18(3), 25-46.
Gordon M.J. (1962) The Investment, Financing, and Valuation of the Corporation. Homewood, IL: R. D. Irwin.
Gordon, M.J. and Gould, L.I. (1978) The cost of equity capital: A reconsideration. Journal of Finance, 33, 849-861.
Gordon, M.J. and Shapiro E. (1956) Capital Equipment Analysis: The Required Rate of Profit, Management Science, 3(1), 102-110.
Habis, H. (2024) A three-period extension of the CAPM. Journal of Economic Studies, 51(9), 200-211.
Hatemi-J A. (2013) A New Asymmetric GARCH Model: Testing, Estimation and Application, MPRA Paper 45170, University Library of Munich, Germany.
Hatemi-J A. (2023) An Alternative Asymmetric GARCH Model with an Application to Falling and Rising Stock Prices. In 2023 27th International Conference on Circuits, Systems, Communications and Computers (CSCC) (pp. 1-5). IEEE.
Hatemi-J A. and El-Khatib Y. (2015) Portfolio Selection: An Alternative Approach, Economics Letters, 135, 141-143.
Hatemi-J A. and El-Khatib Y. (2023) The Dividend Discount Model with Multiple Growth Rates of Any Order for Stock Evaluation. Economia Internazionale / International Economics, 76(1), 135-146.
Hatemi-J A., Hajji M.A. and El-Khatib Y. (2022) Exact solution for the portfolio diversification problem based on maximizing the risk adjusted return. Research in International Business and Finance, 59, 101548.
Lintner J. (1965a). “The Valuation of Risk Assets and the Selection of Risky Investments in Stock Portfolios and Capital Budgets.” The Review of Economics and Statistics, 47, 13–37.
Lintner J. (1965b) Securities Prices, Risk, and Maximal Gains from Diversification. The Journal of Finance, 20(4), 587–615.
Markowitz H. (1952) Portfolio Selection, Journal of Finance, 7 (1), 77-91.
Mossin J. (1966) Equilibrium in a Capital Asset Market, Econometrica, 34(4), 768– 783.
Ross S. (1976) The Arbitrage Pricing Theory, Journal of Economic Theory, 13(3), 341- 360.
Sharpe, W. F. (1964) “Capital Asset Prices: A Theory of Market Equilibrium Under Conditions of Risk.” The Journal of Finance, 19(3), 425–442.
Treynor J. L. (1961) Market Value, Time, and Risk. Unpublished manuscript. “Rough Draft” dated 8/8/61, #95–209.
This paper is
[1] The CAPM model fails empirically in some cases. Andrei et. al., (2023) provide an explanation for this failure. For critical review of the literature on asset pricing via machine learning approach see Bagnara M. (2024). For alternative stock pricing models see, among others, Gordon (1962), Gordon and Gould (1978), Gordon and Shapiro (1956), and Hatemi-J and El-Khatib (2022).