
Table of Links
- ABSTRACT
- INTRODUCTION
- PROPOSED EPIDEMIC CYBER-PHYSICAL SYSTEM MODEL
- PROPOSED INSURANCE PREMIUM PRINCIPLE
- SIMULATION RESULTS
- CONCLUDING REMARKS AND REFERENCES
PROPOSED EPIDEMIC CYBER-PHYSICAL SYSTEM MODEL
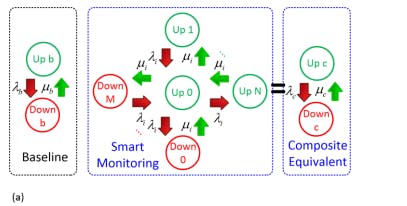
A goal of this study is to gauge the risk of cyberattacks on the individual TGs to determine economical insurance pricing strategies. Fig. 1 conveys the proposed mutual insurance framework as multiple steps: (a) The power system configuration under study should be segmented according to the TGs ownership. (b) Within respective TG substations, smart monitoring and server job assignment are enforced to enhance the substation reliability subject to cyberattacks. (c) Accounting for the cyber connection across the TGs, an ENM is established to stochastically evaluate the long-term impact of cyberattacks. (d) Reliability-based optimal power flow is conducted to estimate the load loss profiles of respective TGs. (e) The insurance premium of each TG is computed based on the corresponding marginal distribution of the loss. A. Epidemic Network Model Fig. 2 illustrates the attack graph of the proposed ENM. The vulnerability 𝑣ℎ is denoted as a colored oval VUL.
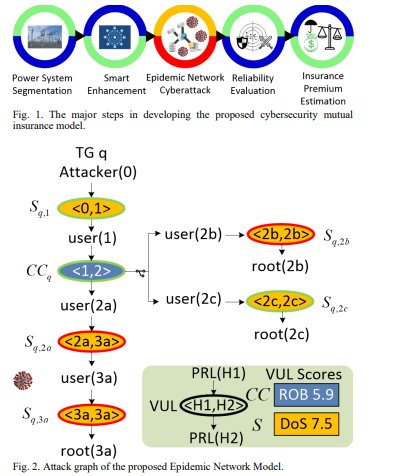
Each node represents a vulnerability. In the proposed ENM, two types of anomalies, ROB and DoS, are considered. ROB attack decrypts the control center’s server privilege by iterating queries to a control server. DoS attack on the substation server is triggered by unauthenticated clients issuing specially crafted messages. The successful exploitation condition of vulnerability 𝑣ℎ occurs Fig. 1. The major steps in developing the proposed cybersecurity mutual insurance model. Fig. 2. Attack graph of the proposed Epidemic Network Model. when the server privilege is obtained by the attacker, denoted as 𝑐ℎ. Vulnerability scores are determined by CVSS comprising the base score, temporal score, and environmental score that take a wide range of attack-related factors into account, including confidentiality, integrity, availability, attack complexity, privileges required, and exploit code maturity [24].
In Fig. 2, the attacker may compromise the substation 𝑆𝑞,1 to start the attack on the q-th TG. Specifically, the attacker deploys anomaly DoS(1) to gain access to the server privilege user(1) of 𝑆𝑞,1 by exploiting <0, 1>. Once 𝑆𝑞,1 is compromised, adjacent <1, 2> of the control center 𝐶𝐶𝑞 can be exploited in a similar manner. Vulnerabilities in cascade are exploited sequentially. In 𝑇𝐺𝑞, the substations and the control center are laid out according to cyber connections in the attack graph. Power dispatching action is feasible along the good routes connecting healthy nodes. Then the good routes are obtained using a routing algorithm such as Depth-First Search [25].
The substations outside of the good routes indicate disconnection from power generation capacity, resulting in load curtailment in the TG. More details can be referred to [26] for cyber network modeling. Physically, exploiting the vulnerability means the attacker breaches the server firewall to gain the server privilege to manipulatively command the substation. According to the attack graph, all preceding and current vulnerabilities should be exploited to compromise a substation server. However, since the substations located at any point of the attack graph may be compromised, an external infection term is established in the Cyber Epidemic Model to include such a possibility. After the substation server is compromised, the attacker may send counterfeit commands to the protective relays to disconnect the major substation IED from grid operations.
The reliability-driven approach adopted in this study is different from contingency analysis on cascading failures. A graphical S-k contingency analysis based on extended enumeration considers the cascading failure by gradually removing the overloaded lines [27]. Worst cases with divergent load flow results are recorded to estimate the substation risk indices. Differently, in the MCS based reliability evaluation procedure, each component status is determined by comparing the random number generated and the FOR of that component. Then, a reliability-based OPF is performed for the sampled state to decide if there is load loss after re-dispatching the power to minimize the overall load loss based on the current system state. Finally, the overall reliability indices can be calculated by sampling enough system states with varying failure scenarios.
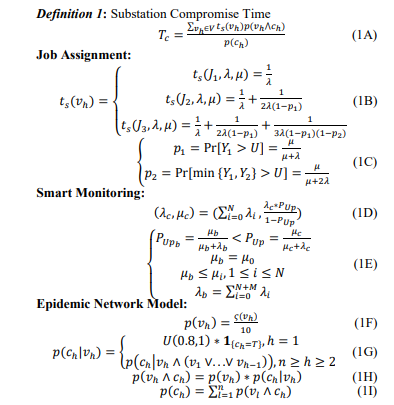
A security metric used extensively in reliability assessment is the SCT 𝑇𝑐 . In Definition 1, 𝑇𝑐 quantifies the time taken by the attacker to bring the substation down. Considering the attack graph, 𝑇𝑐 is logically synthesized with a Bayesian Network [13]. The SCT 𝑇𝑐 is synthesized based on the individual sojourn times 𝑡𝑠 of the vulnerabilities 𝑣ℎ. 𝑡𝑠 is positively correlated to 𝑇𝑐 and the overall system reliability. The smart technologies considered in this work including smart monitoring [14] and job thread assignment [15]. In the job assignment, 𝑡𝑠 corresponds to the memory thread resource in the cyber-physical elements assigned to the operational task. In smart monitoring, the CPS elements deploy preventive and corrective measures to boost substation security. The probability of exploiting vulnerability 𝑣ℎ depends on its score 𝜍(𝑣ℎ). The conditional probability 𝑝(𝑐ℎ |𝑣ℎ ) can be determined by the vulnerability 𝑣ℎ and all the preceding vulnerabilities. The total probability of successful exploitation 𝑝(𝑐ℎ ) is the summation of 𝑝(𝑣ℎ ∧ 𝑐ℎ ).
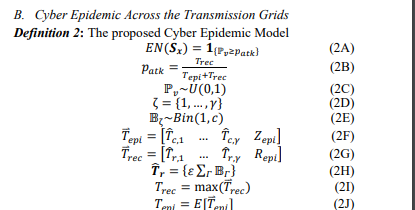
The cyber epidemic model is initiated by a malicious attack described in Definition 2. The cyber epidemic model that infects a vulnerability node may stochastically spread to an adjacent vulnerability node set ζ. State sequence of a specific substation is determined by the infection time vector 𝑇⃑ 𝑒𝑝𝑖 and recovery time vector 𝑇⃑ 𝑟𝑒𝑐 based on the SCTs of ζ and binomially distributed recovery times of ζ. To consider the cyber risks spreading in the large-scale network, external epidemic infection time 𝑍𝑒𝑝𝑖 and recovery time 𝑅𝑒𝑝𝑖 are respectively included in augmented 𝑇⃑ 𝑒𝑝𝑖 and 𝑇⃑ 𝑟𝑒𝑐. The intensity of the epidemic attack can be adjusted by the basic reproduction number 𝜀 and graphical edge coupling number 𝑐.
The substation infection time 𝑇𝑒𝑝𝑖 and recovery time 𝑇𝑟𝑒𝑐 are estimated by the maximum and expected values of the respective vectors. The probability of cyberattack infection 𝑝𝑎𝑡𝑘 is calculated using 𝑇𝑒𝑝𝑖 and 𝑇𝑟𝑒𝑐. Then 𝑝𝑎𝑡𝑘 is compared with a uniform variate to determine whether the substation server is compromised by the cyberattack. The proposed Epidemic Network Model concerns a software-based cyberattack whose impacts would be reflected in the physical power system. When the substations become infected, their operations are compromised. Specifically, the physical loss due to the cyberattack is measured by load curtailment in the reliability analysis. The economic implication of the load loss on TGs is then evaluated in the insurance premium design.
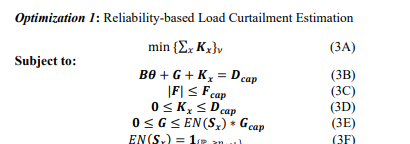
The substation state sequence 𝐸𝑁(𝑺𝒙) is sampled subject to cyber epidemic described in Definition 2, with binary values 1 and 0 indicating the generation capacity 𝑮𝒄𝒂𝒑 connected to the specific substations to be either available or offline. If the substation server is infected by the cyberattack, the attacker could breach the server root privilege and send false tripping commands to the substation relays that cause generation offline. In Optimization 1, 𝐸𝑁(𝑺𝒙) ∗ 𝑮𝒄𝒂𝒑 determines the upper bounds of online capacity 𝑮 at each time step 𝜈. Together with the load capacity 𝑫𝒄𝒂𝒑 and thermal limit constraints 𝑭𝒄𝒂𝒑, the aggregate substation load loss ∑𝑥 𝑲𝒙 is minimized at each time step 𝜈. The energy balance between the online generation supply and online load demand should always be maintained with load curtailment 𝑲𝒙 being further bounded by the load capacity 𝑫𝒄𝒂𝒑.
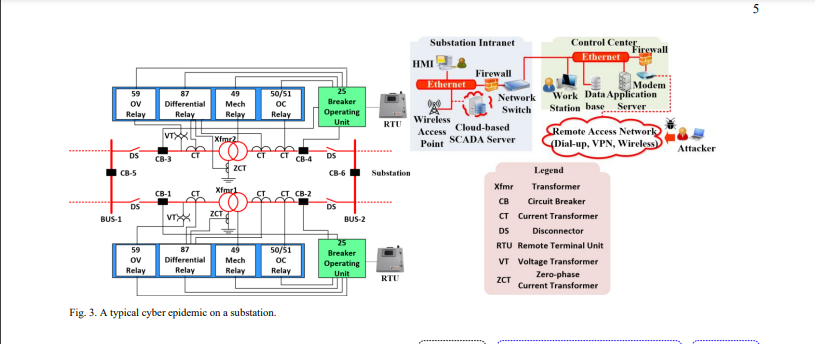
Fig. 3 depicts a typical process of epidemic propagation on a substation. The malicious attacker infiltrates the firewall of the control center through remote access network connected via a modem. If the Ethernet in the control center is breached, the attacker can gain access to the data storage, application server and operation of the workstation. Since WAP controls the substation operation via RTUs, the attacker may directly compromise the substation through the WAP without going through control center. Through infecting the network switch with malware, the attacker may further compromise the substation Intranet. That is, the attacker obtains the privilege of the SCADA server, Human-Machine Interface and the WAP. If the WAP is hacked, false commands can be sent to RTUs to modify the trip settings in different relays. The breaker operating units connected to RTUs coordinate the relays to provide overcurrent protection, overvoltage protection and differential protection. By intentionally reducing the threshold value of the overcurrent relay, the circuit breakers can be falsely tripped when no physical fault condition is presented. A detailed survey further analyzed the impacts of various cyberattack scenarios in the power systems [28]. In the following subsection, the cyber-physical enhancement strategies on the substations will be presented.
C. Substation Cyber-Physical Enhancement
To enhance power system reliability, substation-oriented smart monitoring including SCADA systems and EMU may be worth investments. To highlight the merit of the cyber-physical smart grid with sensing and remedial equipment, reliability modeling of the smart monitoring devices performed in Fig. 4(a) shows a base case of two-state reliability model with failure rate and repair rate (𝜆𝑏, 𝜇𝑏 ) . In Fig. 4(a), the smart monitoring reliability model has M+1 up states ( 𝑈𝑝0~𝑈𝑝𝑀 ) and N+1 (𝐷𝑛0~𝐷𝑛𝑁 ) down states, with failure rate and repair rates (𝜆𝑖 , 𝜇𝑖 ) among respective states.
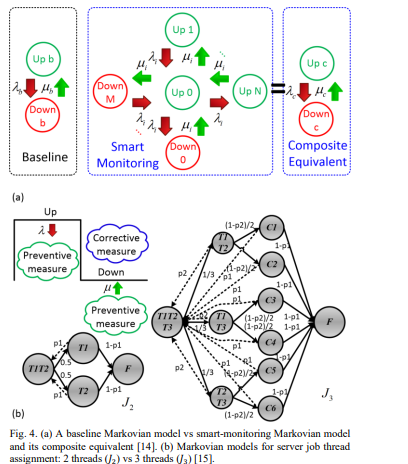
The smart monitoring model can be reduced to an equivalent composite two-state model with the composite failure rate and repair rate (𝜆𝑐 , 𝜇𝑐 ) [14]. For the substation servers, it is crucial to ensure IEDs within the substations with computing capability function normally. In typical operations of computing systems, portions of the memory are dynamically allocated to process-specific tasks. The scheduling strategies in [15] can be adapted to enable improved job thread assignment for our problem. Multiple server threads are scheduled to carry out the same task command of IEDs to heighten the computing dependability against uncertainties. Fig. 4(b) shows a basic 2-thread (𝐽2 ) fault-tolerant job thread assignment procedure assigned with a critical server task in the substation SCADA server. The procedure includes total 4 states: both threads T1T2 carrying out single task, either thread (T1, T2) executing the same task, and the task is terminated when both threads fail F to perform the task.
Similarly, Fig. 4(b) also shows a 3-thread (𝐽3 ) fault-tolerant job thread assignment procedure with 11 states: all 3 threads T1T2T3 conducting single task, 2 of the threads (T1T2, T1T3, T2T3) carrying out the same task, within 2 selected threads one of the threads further fails (C1~C6), and the task is terminated when all 3 threads fail F to perform the task. The sojourn time of 𝐽2 and 𝐽3 are 𝑡𝑠 (𝐽2 , 𝜇, 𝜆) and 𝑡𝑠 (𝐽3 , 𝜇, 𝜆) , determined by the probabilities of state transition, duration of task operation, expected thread recruitment rate 𝜇 and thread residence rate 𝜆. In this study, duration of the task operation and residual time of the job thread executing the task are assumed to be exponentially distributed for simplicity. It will be shown in the case studies the combined application of job thread assignment and smart monitoring can achieve improved grid reliability.
D. Strength of Interdependence
The SCT 𝑇𝑐 is the hypothetical effort where the individual substation privilege access would be obtained by the malicious attacker. Typically, SCTs of the target substations are considered mutually independent in reliability assessment. In this study, all TGs are assumed participants of the proposed mutual insurance to study SoI across the TGs. The sampled SCT vector 𝑻̂𝒄 incorporates a standard uniform variate set 𝒰 into the SCT vector 𝑻𝒄 to produce the correlated loss pattern. 𝑻̂𝒄 = 𝑻𝒄 ∗ 𝒰 (4) Indirect approach is necessary to embed the correlation factor into the uniform variate. Multivariate normal variate 𝑁𝑐~𝑁(𝟎, 𝚺) is handy to allow specification of the correlation 𝑟 in the covariance matrix 𝚺: 𝚺 = (1 + 𝑟)𝒥𝑦 −𝐼𝑦 (5) where 𝑦 is the number of TGs, 𝒥𝑦 is the all-one matrix, and 𝐼𝑦 is the identity matrix. Substituting 𝑁𝑐 = {𝑁𝑐1 , . . . , 𝑁𝑐𝑦} into the cumulative distribution function of the standard normal distribution Φ, a set of uniform variates can be obtained: 𝒰 = Φ(𝑁𝑐) (6) where 𝒰 = {𝒰𝑐1 , . . . , 𝒰𝑐𝑦} is the copula of the uniform distribution with correlation coefficient 𝑟. In the next section, a cyber-insurance principle for estimating the premiums of individual TGs will be introduced.
Authors:
Pikkin Lau, Student Member, IEEE, Lingfeng Wang, Senior Member, IEEE, Wei Wei, Zhaoxi Liu, Member, IEEE, and Chee-Wooi Ten, Senior Member, IEEE
This paper is